

Intro
Sports enthusiasts often talk about the significant differences between regular-season and postseason play. Each sport has its own clichés regarding the important factors that are required to continuously emerge victorious in postseason action.
Recently, Fox’s Colin Cowherd introduced the phrase “Man-alytics,” where he believes some of the advanced analytics utilized in the NBA become rather meaningless in postseason action. This theory concludes that unmeasurable attributes such as coaching, toughness, and awareness trump common efficiency and pace statistics, as well as some even more common statistics like shooting percentage, rebounds, etc.
While, as a sports fan, I believed this to be common knowledge regarding postseason action – I wanted to test this theory with some introductory analytics.
I wanted to develop two separate predictive models, for the intention of predicting the total number of wins, for regular season and postseason action. The 28 variables initially used in this linear regression are listed below, as it includes basic team statistics for offensive and defensive production, as well as some advanced analytics aimed to measure efficiency and pace.
This simple research has two fundamental purposes:
A) Comparing and contrasting which statistical variables are most important for winning in the regular season versus the postseason.
B) Comparing and contrasting the accuracy of both models.
If “Man-alytics” are true, then I believe there will be some discrepancy between the variables in the predictive models, as well as significant differences in accuracy (regular season being much more accurate than postseason).
This is an imperfect test of course, as each NBA team plays a finite amount of regular season games (82), while the participating teams play varying amounts of games in the postseason. Therefore, the accuracy of the Postseason Model should be expected to be lower than the regular season. Just how much lower could help illustrate the truth of “Man-alytics.”
Tested Variables
- Field Goal Attempts (per 100 possessions)
- Field Goal Percentage (per 100 possessions)
- 3-Point Attempts (per 100 possessions)
- 3-Point Percentage (per 100 possessions)
- Free Throw Attempts (per 100 possessions)
- Free Throw Percentage (per 100 possessions)
- Offensive Rebounds (per 100 possessions)
- Defensive Rebounds (per 100 possessions)
- Steals (per 100 possessions)
- Blocks (per 100 possessions)
- Blocks Allowed (per 100 possessions)
- Personal Fouls (per 100 possessions)
- Personal Fouls Drawn (per 100 possessions)
- Opposing Field Goal Attempts (per 100 possessions)
- Opposing Field Goal Percentage (per 100 possessions)
- Opposing 3-Point Attempts (per 100 possessions)
- Opposing 3-Point Percentage (per 100 possessions)
- Opposing Free Throw Attempts (per 100 possessions)
- Opposing Free Throw Percentage (per 100 possessions)
- Opposing Offensive Rebounds (per 100 possessions)
- Opposing Defensive Rebounds (per 100 possessions)
- Opposing Steals (per 100 possessions)
- Pace
- Assist Ratio
- Turnover Ratio
- Rebound Rate
- Effective Field Goal Percentage
- True Shooting Percentage
Data Sets:
I will be using the previous three completed seasons as the training set, and the most recent completed season as the validation set (66.66% to 33.33% Training to Validation). For the Regular Season set, this would include the 2015, 2016 and 2017 seasons (90 observations) and the 2018 season as the validation set (30 observations). For the Postseason set, this would include the 2014, 2015 and 2016 postseasons (48 observations) and the 2017 postseason as the validation set (16 observations).
Regular Season:
The initial regression eliminated eight variables. Using Mallow’s CP Selection Model, the most optimal predictive model is shown below. The R-Squared for this model was 93.37%, which essentially means this model is believed to explain 93.37% of the variability for a team’s total wins in a given season.
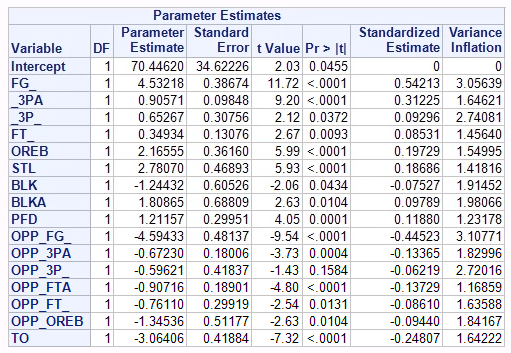
Positive Relationships (the higher this statistical category, the more wins one is bound to have) in order of significance (the closer the coefficient is to zero, the less influence it has on the predicted outcome):
- Field Goal Percentage (4.53)
- Steals (2.78)
- Offensive Rebounds (2.17)
- Blocks Allowed (1.81)
- Personal Fouls Drawn (1.21)
- 3-Point Attempts (0.91)
- 3-Point Percentage (0.65)
- Free Throw Percentage (0.35)
Negative Relationships (the higher this statistical category, the less wins one is bound to have):
- Opposing Field Goal Percentage (-4.60)
- Turnover Ratio (-3.06)
- Opposing Offensive Rebounds (-1.35)
- Blocks (-1.24)
- Opposing Free Throw Attempts (-0.91)
- Opposing Free Throw Percentage (-0.76)
- Opposing 3 Point Attempts (-0.67)
- Opposing 3 Point Percentage (-0.59)
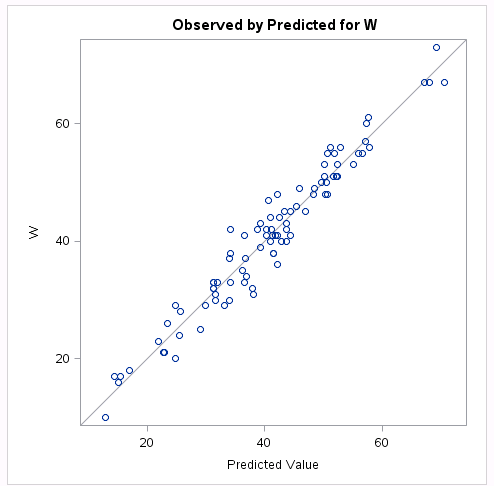
When testing this predictive model on the validation set (2018 Regular Season), the average accuracy was about 91.5%, close to the adjusted R-Square score of 93.37%.
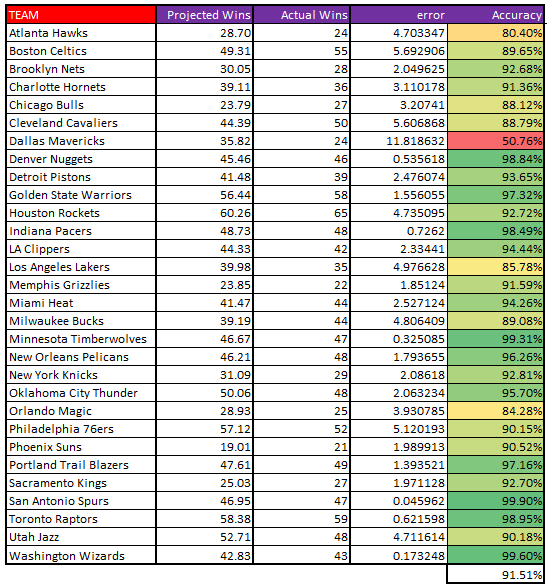
Tanking? The Dallas Mavericks, whose owner Mark Cuban openly discussed “Tanking,” were projected to win about 36 games. They only won 24. An interestingly and alarmingly inaccurate projection.
Postseason:
The initial regression eliminated six variables. Using Mallow’s CP Selection Model, the most optimal predictive model is shown below. The R-Squared for this model was 60.03%, which means this model is believed to explain 60.63% of the variability for a team’s total wins in the postseason (much lower than the regular season model).
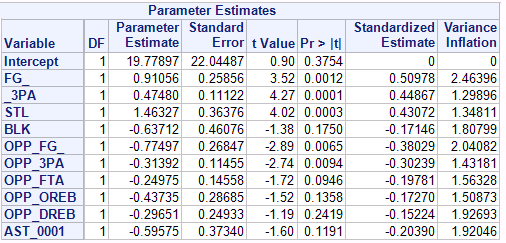
Positive Relationships in order of significance:
- Steals (1.46)
- Field Goal Percentage (0.91)
- 3-Point Attempts (0.48)
Negative Relationships in order of significance:
- Opposing Field Goal Percentage (-0.78)
- Blocks (-0.64)
- Assist Ratio (-0.60)
- Opposing Offensive Rebounds (-0.44)
- Opposing 3 Point Attempts (-0.31)
- Opposing Defensive Rebounds (-0.30)
- Opposing Free Throw Attempts (-0.25)
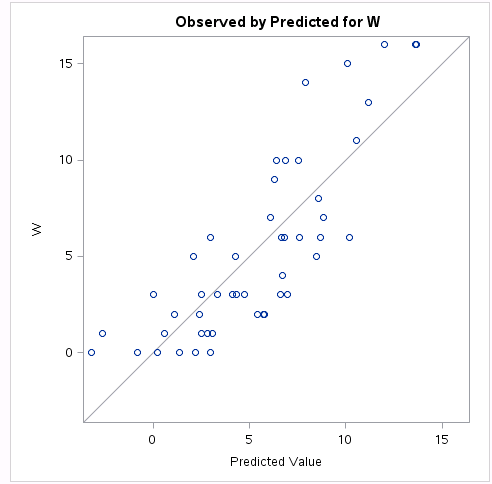
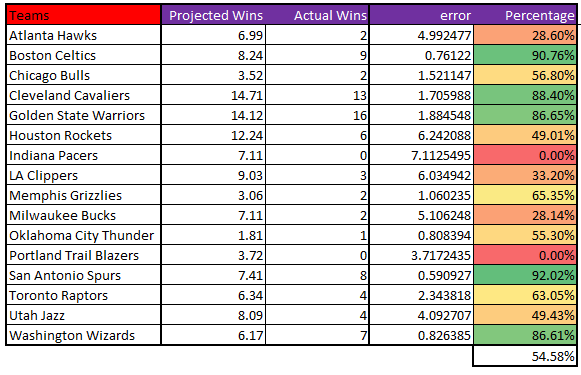
When testing this predictive model on the validation set (2017 Playoffs), the average accuracy was 54.58%, somewhat close to the adjusted R-Square score of 60.03%.
Conclusions: Readdressing the Purpose:
A) Comparing and contrasting which statistical variables are most important for winning in the regular season versus the postseason.
Steals: Field Goal Percentage and Steals were the most important positive variables in each model. While the significance of field goal percentage is seemingly a foregone conclusion, steals is not a statistic that is as popularized in terms of importance. Furthermore, Steals became even more important in the postseason, leapfrogging Field Goal Percentage, which perhaps eludes to the “Defense Wins Championships” mentality.
Rebounding in the Playoffs: It seemed more important to control the glass (limit opposing offensive and defensive rebounds) in the playoffs than in the regular season. Only Opposing Offensive Rebounds were included in the Regular Season model.
Emphasis on 3 Point Attempts: Perhaps due to the Warriors success and the transition to a new style of space-the-floor-basketball, maximizing 3 Point Attempts per 100 possessions and limiting the opposition’s 3 Point Attempts per 100 possessions was universally important… even more important than the actual percentage of successful attempts.
Blocks are counterproductive: Most of the variables and its respective relationship with the dependent variable make sense… except the variables Blocks and Blocks Allowed. According to both models, blocks a given team averaged per 100 possessions would actually hurt the win projections. Oppositely, for the regular season model, the more blocks one team allowed per 100 possessions, the more wins they would claim. Perhaps the more blocks a team has signifies the need for rim protection, which could indicate that the team allows the opposition to get the rim too frequently. Oppositely, the more blocks one team allows may indicate that they are simply getting to the rim more frequently and therefore risking the threat of blocked shots more frequently. Just a theory.
Assist Ratio: Like blocks, the assist ratio (the percentage of a team’s possessions that end in an assist) oddly had a negative relationship with winning in the postseason model. Perhaps this is an example of isolation-oriented offenses, such as the Oklahoma City Thunder and Houston Rockets, finding success in recent playoffs. This is something that can be evaluated further, as some of the teams without a superstar in the 2016 Playoffs (Detroit, Atlanta, and Dallas) had high assist ratios, but did not find much success.
B) Comparing and contrasting the accuracy of both models.
As aforementioned, these are imperfect predictive models. It does not take into account strength of schedule, injuries to significant players, or the lopsided nature of the Eastern Conference playoff bracket versus the Western Conference playoff bracket. And as predicted, given the differences in varying games played in a playoff setting, the playoff bracket was much less accurate in terms of the Adjusted R-Square Score and the average accuracy of the validation sets.
However, the substantial differences can also help illustrate the possibilities of the “Man-alytics” theory being somewhat correct. While the regular season model was highly accurate in relation to the validation set (nearly 92% – and if you eliminate the outlying and tanking Dallas Mavericks, over 93%), the postseason model was not (about 55% accurate). The previously mentioned unmeasurable variables – coaching, toughness, awareness – play a more significant role in the variability of total wins in the postseason than in the regular season.
Of course, there are more games in the regular season – thus more of a likelihood for the statistics to paint a clearer portrait of a given team. However, I did not want to include more seasons in the training sets. Basketball, like many sports, is ever-changing. What was important five years ago may not be as applicable to today’s game.
While this is an imperfect predictive model with basic linear regressions, I believe it is safe to conclude that the “Man-alytics” theory has some statistical validity.
Check out my quick thoughts on Legalized Gambling on the Horizon.
Photo: http://www.sportingnews.com/nba/news/nba-playoffs-2018-preview-prediction-game-4-rockets-timberwolves-thunder-jazz/au9ttqumk4h4141fhgicfvx3w
Data obtained from Stats.NBA.com & ESPN.com/NBA/Hollinger/TeamStats
